401(k) Balance by Age: How Do You Actually Stack Up?
If you've ever wondered whether your 401(k) balance is on track, you're not alone. Most people have no idea whether they're ahead, behind, or in the middle of the pack—and without context, your balance is just a number. Here's what the data actually says, why the averages can be misleading, and what you should do if you're behind.
Reference: https://www.plootus.com/401k-by-age
Why 401(k) Balances Matter More Than Ever
The traditional three-legged retirement stool—Social Security, pension, and personal savings—has collapsed for most Americans. Fewer than 15% of private-sector workers now have access to a defined-benefit pension. That means your 401(k) is no longer a supplement to retirement income; for most workers, it IS retirement income.
This shift makes understanding benchmarks critical. The difference between retiring comfortably and working until 70 often comes down to a few percentage points of contribution rate, sustained over decades.
Average vs. Median: Understanding the Data
When looking at 401(k) benchmarks, it's essential to distinguish between average balances and median balances. Averages are dramatically skewed by high-balance accounts. A small number of workers with $2–5 million in their 401(k) can pull the average far above what a typical worker actually holds. The median—the midpoint where half of savers have more and half have less—is more representative of where most people actually stand.
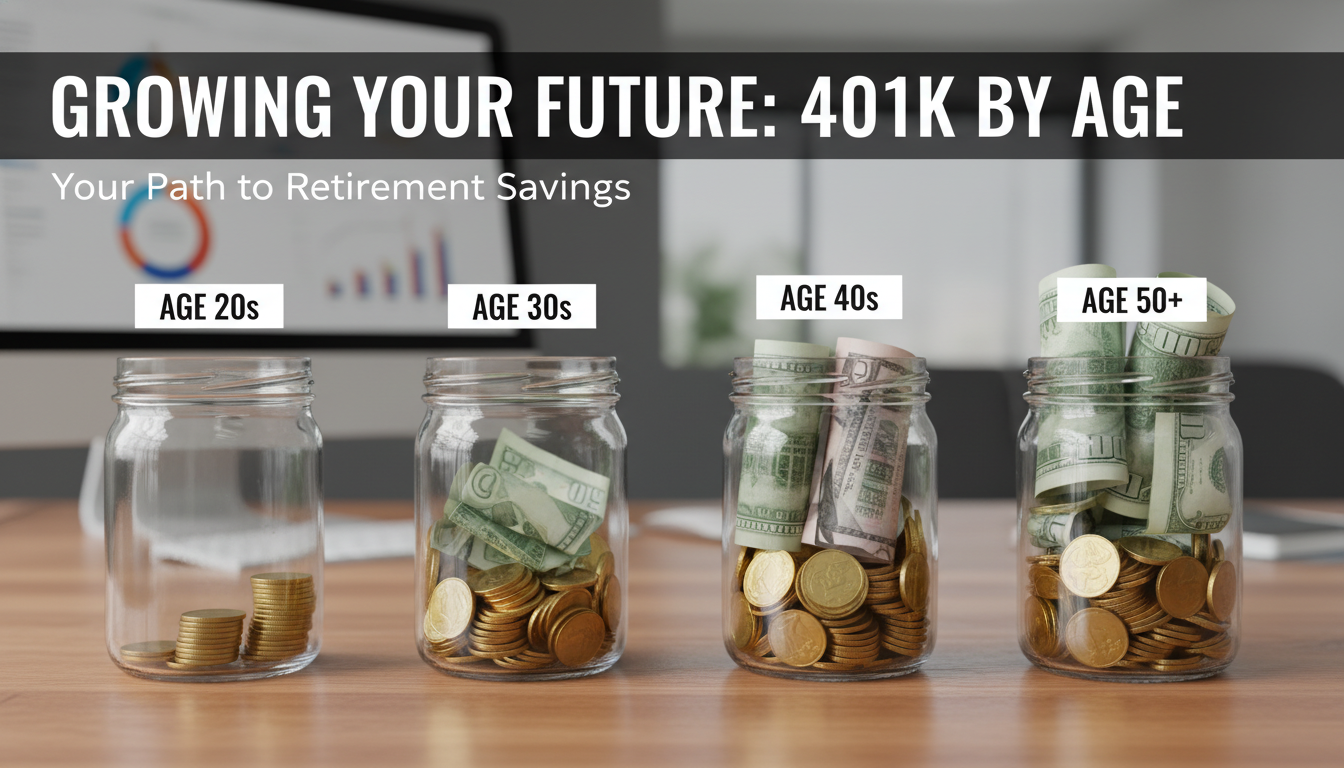
401(k) Balance Benchmarks by Age Group
In Your 20s: Building the Foundation
Workers in their 20s are typically just beginning their 401(k) journey. Average balances hover around $10,000–$15,000, while medians are often below $5,000. This is normal—and the compounding math means that even modest contributions in this decade are disproportionately powerful. A 25-year-old who saves $3,000 this year will have roughly $48,000 from that single year's contribution by age 65, assuming 7% average annual growth.
The priority in your 20s: capture the full employer match. It's the closest thing to a guaranteed 50–100% return on investment that you'll ever find.
In Your 30s: The Critical Growth Decade
Your 30s are when 401(k) balances start meaningfully diverging based on contribution habits and life choices. Average balances in this age group typically fall between $40,000 and $70,000, while median balances are often in the $20,000–$35,000 range. Many workers in this decade face competing financial pressures—mortgage down payments, childcare, student loan repayment—that suppress contributions.
Retirement experts commonly suggest a target of roughly 1–2x your annual salary saved by 35. If your salary is $75,000 and your balance is $50,000–$100,000, you're tracking reasonably well.
In Your 40s: The Wealth-Building Decade
Your 40s should be peak earning years, ideally with declining consumer debt and increasing contribution capacity. Average balances typically reach $100,000–$150,000, with medians around $50,000–$70,000. The gap between the average and median reflects the bifurcation of American retirement preparedness—some are thriving, many are falling behind.
A common benchmark: 3x your salary by age 44–45. If you haven't caught up on contributions in your 30s, your 40s represent the last decade where compounding significantly amplifies additional contributions.
In Your 50s: The Home Stretch (and Catch-Up Contributions)
Workers 50 and older gain access to catch-up contributions—an additional $7,500 per year on top of the standard limit in 2024 ($23,000). This provision exists precisely because many workers in their 50s realize they're behind and need to accelerate. Average balances in the 50s range from $180,000 to $250,000, with medians around $90,000–$120,000.
Target benchmark: 5–7x your salary by 55. A $90,000 earner should be eyeing $450,000–$630,000 by mid-decade.
In Your 60s: Pre-Retirement Assessment
Your 60s are when planning shifts from accumulation to distribution. Average 401(k) balances for people in their early 60s often reach $200,000–$350,000, but these averages mask enormous variation. Workers who contributed consistently for 35+ years at above-average rates can have $1 million or more; workers who started late or withdrew early may have far less.
Target benchmark: 8–10x your final salary at 67 (Fidelity's standard guidance). At this point, Social Security timing strategy and healthcare cost planning become as important as the balance itself.
Why Most People Fall Short—and What to Do About It
The most common reasons people fall below benchmarks include: starting contributions late, cashing out when changing jobs (a decision that costs thousands in taxes, penalties, and lost compounding), contributing only enough to get the match rather than maximizing contributions, and taking 401(k) loans for non-emergency expenses.
If you're behind, the path forward depends on your timeline. In your 20s–30s, the most powerful lever is increasing your contribution rate by just 1–2% annually. In your 40s–50s, maximizing contributions and eliminating high-interest debt is the priority. In your 60s, delaying retirement by even 1–2 years and deferring Social Security claiming can dramatically improve lifetime income.
Tools That Close the Gap
Benchmarks are a starting point, not a verdict. Use retirement income calculators to project what your current balance will generate in monthly income, and compare that against your projected expenses. Then adjust contribution rates, expected retirement age, or spending plans accordingly.
The goal isn't to match an average—it's to ensure your 401(k) supports the specific retirement life you want to live.